Live Smart Analysis
At Fxdatapanel, we understand that sometimes traders also require smart analysis of the market. The smart report includes the technical and fundamental aspects of the market. For that reason, we have added the smart analysis feature. It provides a quick technical and fundamental overview of any instrument, including currency pairs, indices, crude oil, spot gold and silver.
The report also includes Forex analysis and signals. The smart analysis report also shows the performance of Fxdatapanel trade signals. You can see the signal performance with positive and negative trade signals right from the start. You will also have a combined success rate of the grid and straight signals. Additionally, the report will also show you the 1-year trade signal performance.

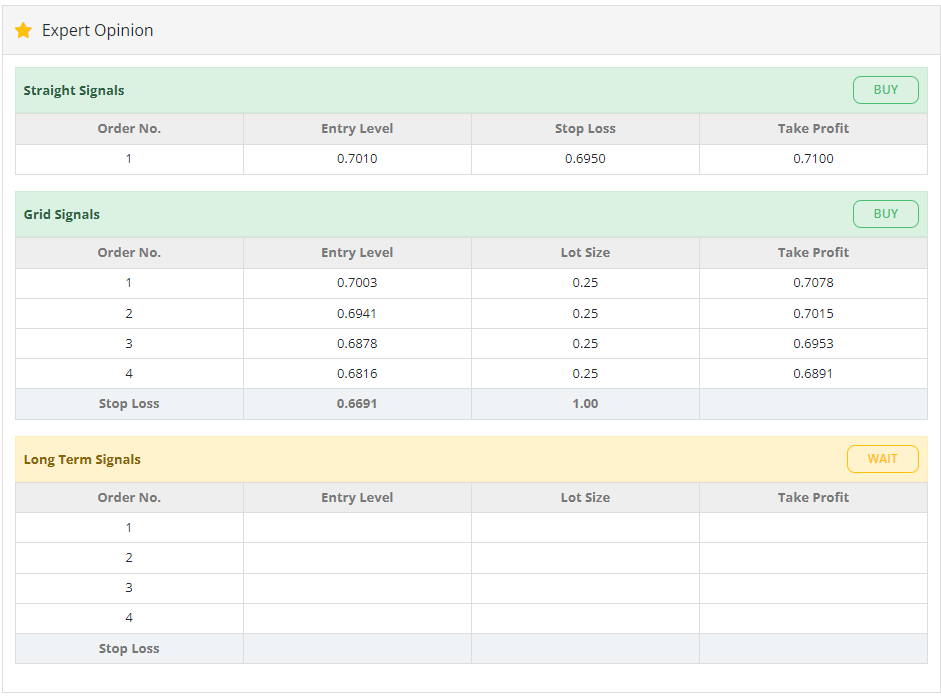
Best Forex Expert Opinion
The most prominent section of the smart report is the expert opinion section. This section gives you the buy-sell trade signals from the Fxdatapanel experts. The FXDatapanel expert generates these signals using our proprietary algorithm and best trading strategies.
Remember, the daily signals in the expert opinion section differ from those generated using the Fxdatapanel platform. Trader’s generate the signals from the platform based on their requirements, while Fxdatapanel experts give the signals in the smart analysis report.
Forex Technical Report
Besides the expert opinion section, the smart analysis also provides the support and resistance levels along with readings from several technical indicators such as Pivot Points, Average True Range (ATR), etc. The report includes hourly, daily, weekly, and monthly pivot points.
Further in the technical snapshot, you will get the overbought and oversold information from momentum indicators such as Stochastic, Relative Strength Index (RSI), and Bollinger Bands. Three Simple Moving Averages (SMA) with 20, 50, and 100 periods provide further insight into the market.
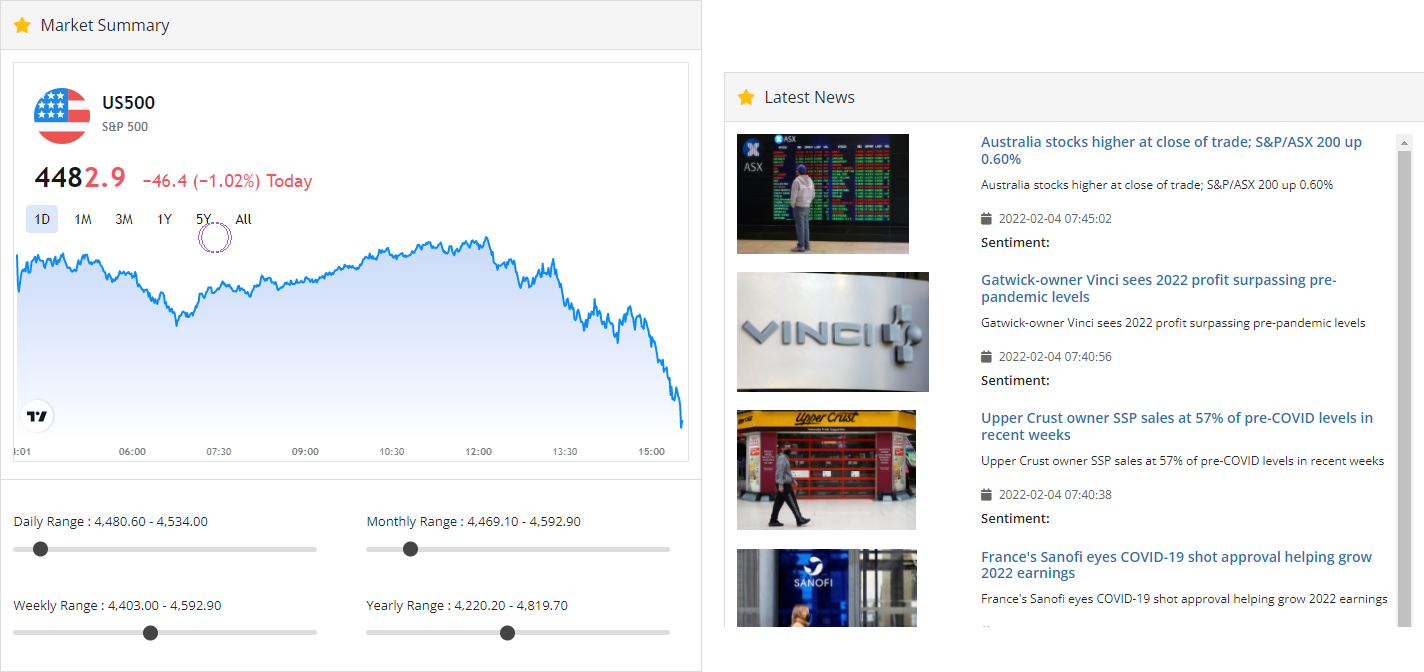
The smart analysis report also includes a market summary and Forex news sections. You will also find the support and resistance levels on a short, mid, and long-term basis.


FXDatapanel Strategy Heat Map
The report also has a strategy heat map section. The platform uses these stratagies to generate the trade signals. The heat map outlines the trending signal in easily identifiable colors. You can view the strategy heat map across hourly, weekly and monthly timeframes. You can further filter the signals by changing the trade signal strength level to normal, average, or strong.

Forex Live News Section
A market summary of the instrument is also available in the report, along with all the related latest news. The news section is particularly helpful as most traders ignore the market's fundamental side.
